Factlink’s Fact Graph
Factlink started with a mission to annotate the world’s information, and to provide a platform in which credible information can surface. We called the second part the “Fact Graph”: the interfaces for linking pieces of text on the web together, and a calculation that shows for each piece of text how credible it is.
For the last six months, we haven’t focused on the Fact Graph, as we wanted to get annotation right first. But today, we’re sharing the insights from the hundreds of hours of research into the Fact Graph. We look at our collaborative “fact checking” system in detail, especially the mathematics and user interfaces.
Factlink’s original idea
What did we try to do anyway? In an internal document we wrote (emphasis added):
“The goal of Factlink is to solve the problem of assigning credibility to sources. The traditional mental model of a few authoritative sources, such as investigative journalism and peer reviewed science, falls short in a world with billions of tweets and blogs. And, finding correct information simply based on text search and popularity does not seem to be a sustainable trend. Factlink tries to solve this fundamentally hard problem by assigning scores to strings of text annotated by its users.”
In short, we tried to show if what you’re reading is true or not.
Annotation
We started out with annotating sentences on websites. After installing a browser extension, you could select a piece of text on any website, and create an annotation. We called these annotations “Factlinks”. It worked like this:
- Select a piece of text
- Give your opinion on the piece of text: “agree”, “disagree”, or “neutral” (which we later renamed to “unsure”)
- A Factlink is created.
Once you created a Factlink on a website, other people with the browser extension could see it. It didn’t modify the website directly, as that’s generally not possible, but it altered how the website is rendered using the browser extension.
You could then post the Factlink to a channel, such as “Brain development”. Others who subscribed to that channel, such as experts or interested people, would see the Factlink on their activity feed. They could then give their opinion, add sources, and comment on the Factlink.
The annotation part of Factlink still works similarly to what we had originally, except that we used to mark Factlinks using a checkmark in front of the text, while we now show an icon on the right of a paragraph.


Voting on statements
You could open a Factlink by clicking on the text. You would then see a circle with three colours, which we called the “Factwheel”. It served several purposes:
- The Factwheel showed the credibility of a piece of text. Green meant credible. Red meant not credible. Blue meant uncertainty.
- The number inside the Factwheel represented the amount of "thinking" people have put in to get at this number. The higher this number, the more reliable the credibility calculation.
- You could click a colour on the Factwheel to cast a vote, for whether you agree, disagree, or are unsure.
Initially, we started out with just voting. If you agreed, you clicked the green part, which would grow a bit. And the number inside the circle would become higher. Similarly for the red and blue parts.
Linking statements
However, truth is not a popularity contest. Prevailing “truths” have often turned out not to be very true at all: the earth “was” once flat. So what is more powerful than opinions, what is a better predictor of truth? Hard evidence.
The key idea of our credibility calculation was evidence. You could add Factlinks as evidence for another Factlink. This evidence could be either supporting or weakening. If the supporting Factlink was likely to be true, then the Factlink it supported was also more likely to be true. If a weakening Factlink was likely to be true, then the Factlink it weakened was more likely to be false. We called this network of evidence the “Fact Graph”.
An example. Factlink 1 (F1) is: “Working from home is more productive than working in an office.” You could find a website talking about personal experience, and annotate F2: “I’m much happier working from home, so I work harder.” You can then add F2 as supporting evidence to F1. If it turns out that F2 is very credible — many people voted that they agree, or it gets a lot of supporting evidence — then in turn F1 will also become more credible. The green part of the Factwheel of F1 will become bigger.
Say you find a counter argument on the web, which you annotate. F3: “In conclusion, in 89% of the cases we have looked at, working in the office was most productive.” This one might be added as weakening evidence to F1. If it turns out F3 is credible, then F1 becomes less credible. The red part of the Factwheel of F1 will become bigger.
What if someone adds nonsense supporting evidence, F4: “The sky is blue.” Someone can do this to falsely increase the credibility of F1, especially if F4 itself is very credible.
We could have users reporting such invalid arguments, and have them removed by a moderator. But it might also be that evidence that looks like nonsense, is in fact relevant. It might just be that you don’t understand the subject matter well enough, or that it needs further explaining. Relevance isn’t binary — either relevant or irrelevant — but it’s a scale.
In other words, we are not just interested in the credibility of Factlinks, but also in the credibility of relations between Factlinks. In our model, in the same way you can vote on the credibility of Factlinks, you can vote on the credibility of the relations between Factlinks: evidence. In an attempt to avoid confusion, we call this voting on relevance. You can agree or disagree that evidence is relevant.
In theory, you could visualise the relevance of evidence with a Factwheel. However, to avoid confusion, we chose a different representation: voting arrows.

Calculating credibility
How can we use these votes and evidence to get to a summary of how credible a Factlink is? For this, we first introduce some math. We define a credibility tuple to be a tuple of three numbers: <true, false, unsure>, or <t, f, u>. These numbers represent how true, how false, or how unsure a Factlink is. The size of each number represents how much “work” or “thinking” has gone into reaching this conclusion. For now, let’s just say it’s the number of votes.
We denote the credibility tuple of a Factlink F1 as c(F1). The numbers t, f, and u correspond to green, red, and blue parts of the Factwheel. The number inside the Factwheel is the sum of those numbers, representing the total amount of votes, or the amount of “thinking” people have put in. For example:
c(“Generally agreed upon Factlink”) = <10000, 8, 13>
c(“Factlink with only few votes”) = <2, 1, 0>
c(“Factlink without any votes”) = <0, 0, 0>
c(“Highly controversial Factlink”) = <7839, 8009, 3041>
c(“Vague or unknown Factlink”) = <182, 119, 1205>
To be a bit more precise, the voting part of F1’s credibility tuple cv(F1) is the sum of the credibility tuple of individual votes. An “agree” vote corresponds to <1, 0, 0>, a “disagree” vote to <0, 1, 0> and an “unsure” vote to <0, 0, 1>.
To calculate the sum of different votes, we need to define addition on credibility tuples. An intuitive choice would be to just add up the numbers:
<t1, f1, u1> + <t2, f2, u2> = <t1+t2, f1+f2, u1+u2>
Now, if you have a Factlink F1 with, say, 2 agreeing votes, and 1 disagreeing vote, you would get:
cv(F1) = <1, 0, 0> + <1, 0, 0> + <0, 1, 0> = <2, 1, 0>
Looks reasonable, right? It becomes more interesting when we add evidence. How does useful evidence change the credibility calculation? One way to look at it is to say that useful evidence is the same as a lot of people voting. Bad evidence is the same as only a few people voting.
For example, if you have supporting evidence, that a lot of people find relevant, and a lot of people think is true, then that could count as a big vote in favour of the Factlink, say <300, 0, 0>. Such evidence would weigh the same as 300 people voting in favour, so there must be a darn good reason why it weighs so much. In our model there must be 300 people agreeing with the supporting Factlink, and 300 people saying that the relation is relevant. If either the credibility or relevance is lower, the evidence won’t weigh as much.
So, the evidence part of a Factlink’s credibility tuple is the sum of the credibility tuple of its evidence. Supporting evidence, denoted as F2 F1 (F2 supporting F1), has a credibility tuple c(F2 F1). The same goes for weakening evidence, F3 F1. Such a tuple is made up of the relevance votes on the evidence, and the credibility tuple of F2:
c(F2 F1) = <min(t1-f1, t2-f2), 0, 0>
where <t1, f1, u1> = cv(F2 F1) (up/downvotes on evidence)
and <t2, f2, u2> = c(F2)Similarly, c(F3 F1) = <0, min(t1-f1, t2-f2), 0>
This ensures that we don’t puff up the importance of this complex opinion more than any of its constituent parts and bounds the information that can pass through evidence. It allows highly credible Factlinks to support or weaken other Factlinks, but requires matching relevance of the relationship to transmit their credibility.
The final credibility tuple of a Factlink F1 is the sum of the voting part cv(F1), and of the evidence part ce(F1), which we define as the sum of tuples of evidence of F1. An example:
F1 = “peanut butter is great”, cv(F1) = <4, 2, 8>
F2 = “peanut butter has great taste”, c(F2) = cv(F2) = <10, 3, 0>
F3 = “peanut butter has awful texture”, c(F3) = cv(F3) = <6, 4, 2>
cv(F2 F1) = <11, 2, 0>
cv(F3 F1) = <9, 3, 0>Then:
c(F2 F1) = <min(11-2, 10-3), 0, 0> = <7, 0, 0>
c(F3 F1) = <0, min(9-3, 6-4), 0> = <0, 2, 0>
So ce(F1) = c(F2 F1) + c(F3 F1) = <7, 2, 0>
So c(F1) = cv(F1) + ce(F1) = <4, 2, 8> + <7, 2, 0> = <11, 4, 8>
When now looking at F1, you will see that the prevailing opinion is that peanut butter is great, even though the majority of people didn’t vote directly in agreement with that. However, quite a few people agreed with the underlying supporting evidence, and enough people agreed that the evidence was relevant.
The kicker is that this final credibility tuple of F1 is used when F1 is used as evidence for other Factlinks, allowing votes to propagate throughout the network of Factlinks and evidence.
Variations
We’ve had various variations on this calculation, which might be worth mentioning. For example, you could add evidence for the uncertainty of a Factlink, which would add to the number of unsure votes.
The most notable addition was authority. You could gain authority when people found your evidence relevant. This encouraged making good connections between Factlinks. We didn’t award authority if someone agreed with a Factlink you annotated, as you shouldn’t be punished for not posting agreeable content. After all, the whole point was to call out misinformation on the web.
Authority was then used to weigh votes. The votes of people with high authority would weigh more than the votes of people with low authority. This way we tried to build moderation into the system: if people appreciated the evidence you posted, then your vote would weigh more than that of people who weren’t yet appreciated by the community.
Of course, people who have expertise on one topic don’t necessarily know much about other topics. That’s why at one point we even had topic-specific authority, weighed by “topic channels” that people posted Factlinks to. But that’s another story.
User interface
The calculation had been designed to be directly visualised and interacted with. But building a good user interface proved tricky. We started out with tabs for supporting and weakening evidence. But that meant that the initially opened tab got the most attention, an undesirable bias.
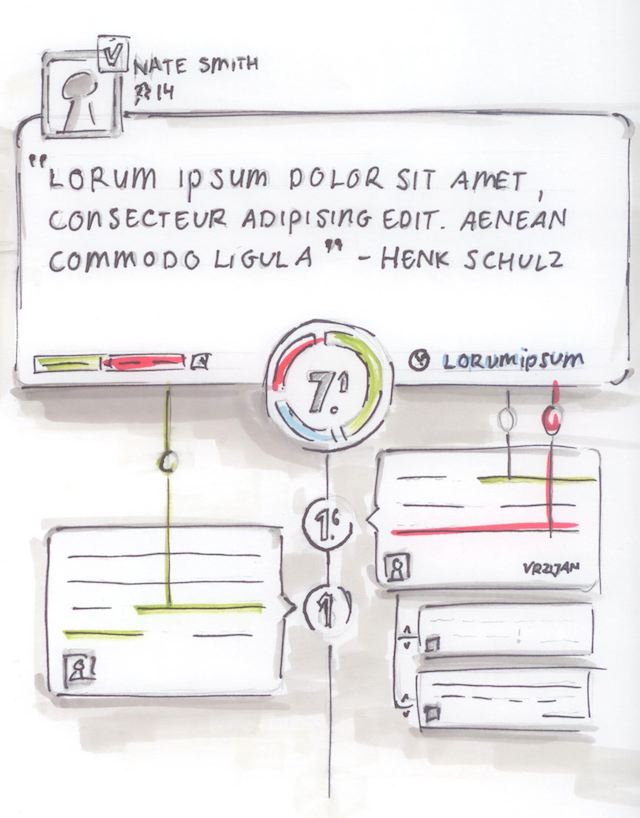
More importantly, there were too many numbers on the screen, which was overwhelming to many users. It also wasn’t clear what all the different numbers meant. We tried to address those problems with a design that showed all votes and evidence in one overview:


In this design, the numbers in the middle represent not the relevance of the evidence, but the total number of votes contributed by the evidence’s credibility tuple (e.g. t from c(F2 F1)). All the numbers in the middle add up to the big number on top, which represents the “total amount of thinking” or “brain cycles” that people have put into it.
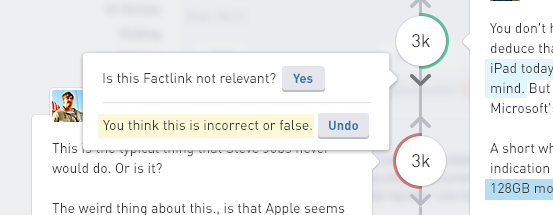
Showing total contributing votes instead of relevance also subtly changed the meaning of upvote and downvote buttons. If you click upvote, you want the number to go up. Just adding an agreeing vote to the relevance of the evidence is not enough, as you often also need to agree with the underlying Factlink. Therefore we added popups when clicking on an upvote or downvote button, to ask what you think exactly:

Epilogue
In the end, we didn’t gain enough traction with this part of Factlink, and decided to focus on annotation. But we think the idea was quite intriguing. We hope that someday online communities can visibly work together to assess the credibility of statements using evidence. To curb misinformation. We hope to have inspired you.
Originally from factlink.com/blog/factlinks-fact-graph; moved here in November 2020.